TUI
BLXBench interactive Terminal User Interface.
BLXBench features a modern Terminal User Interface (TUI) built with Ink and React. It provides a command-driven experience for configuring providers, selecting models, running benchmarks, and submitting reports.
Install the CLI globally as @bitslix/blxbench (see Installation); the binary name remains blxbench. To upgrade the CLI, use the same global package manager you used the first time — Updating blxbench has npm, pnpm, and Bun examples and explains the optional “newer on npm” info box on the welcome screen.
Starting the TUI
blxbenchScreens
Welcome Screen
When OPENROUTER_API_KEY is not set (after the config merge), the TUI opens a first-run setup screen instead of the usual banner: enter your OpenRouter key once (input is masked) and it is stored in ~/.blxbench/config.json under env, then you continue to sign-in.
Choosing LM Studio (lms) or Ollama (oll) in /provider when the optional LMSTUDIO_API_KEY / OLLAMA_API_KEY is unset opens the same style of screen: save a token to config.json, or press Enter on an empty field (or S) to skip if you do not need auth locally.
After selecting lms or oll, traffic uses 127.0.0.1 only. If your daemon listens on a non-default TCP port, set it with /local-inference-port <n> (or off / unset for the adapter default) before /run; /show echoes the active override when present.
If the project ./.env and config.env both define that key, you may see a short picker to prefer workspace, stored, or ignore workspace .env — see Configuration — App config file.
Otherwise you see the normal welcome / sign-in flow:

Arcade (minigames)
Open BLXBench Arcade from the shell with /arcade—or press a while a benchmark is actively running tests so the console job keeps going underneath. Esc / q closes the overlay only.
Help & Commands
View available commands and shortcuts:

Account Management
Sign in to upload results to the leaderboard:

Configure Run
Select provider, models, and test filters:

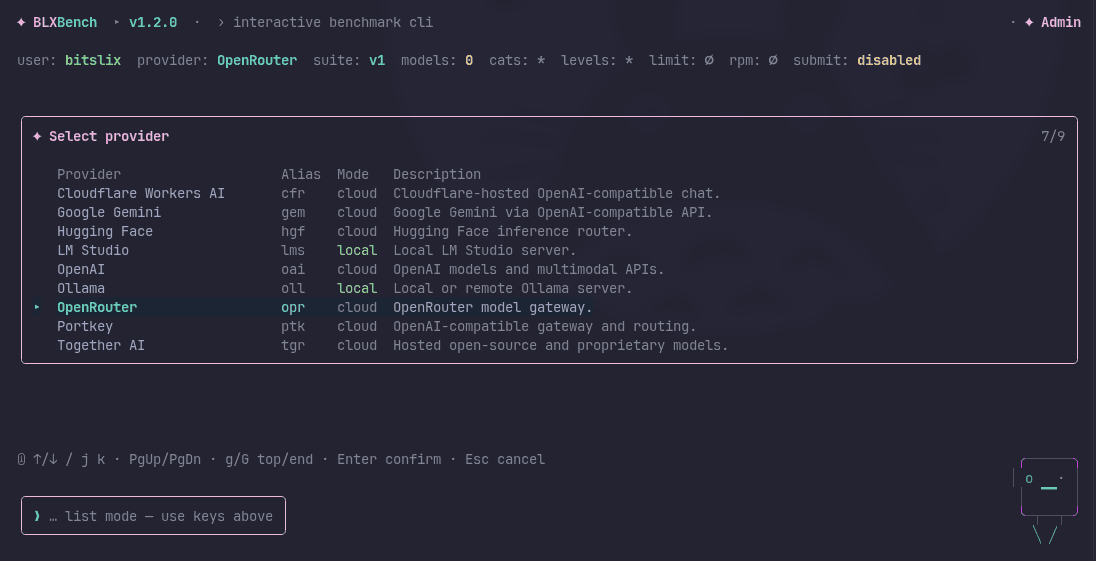
Provider list
Use /provider (or /set provider) to open the provider picker. Each row shows the alias, cloud or local mode, and a short description:
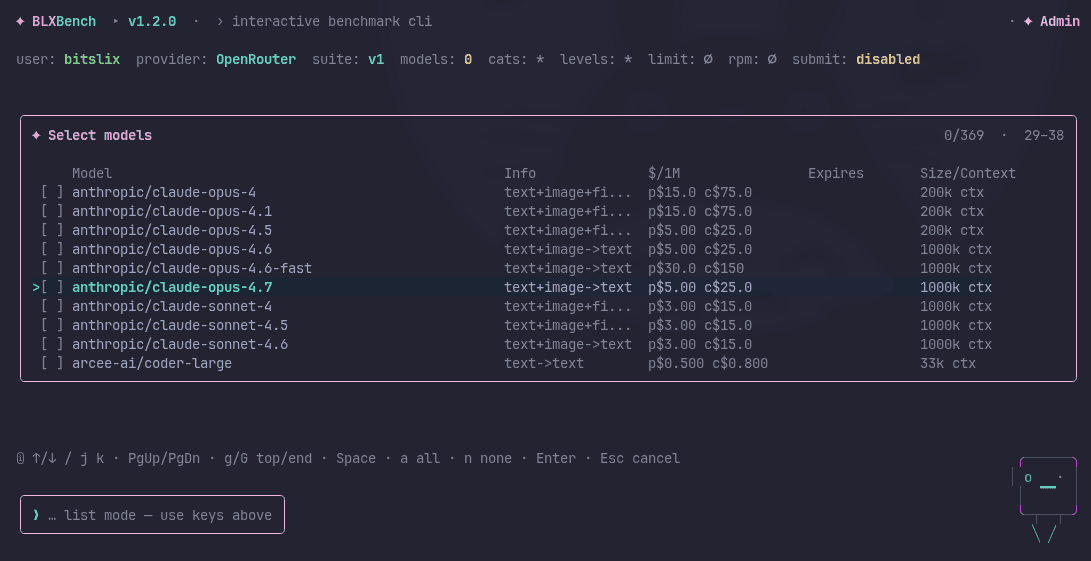
Model list
Use /models list (or /set models) to open the live model picker from your current provider. The list shows modality info, pricing per million tokens, expiry, and context size:
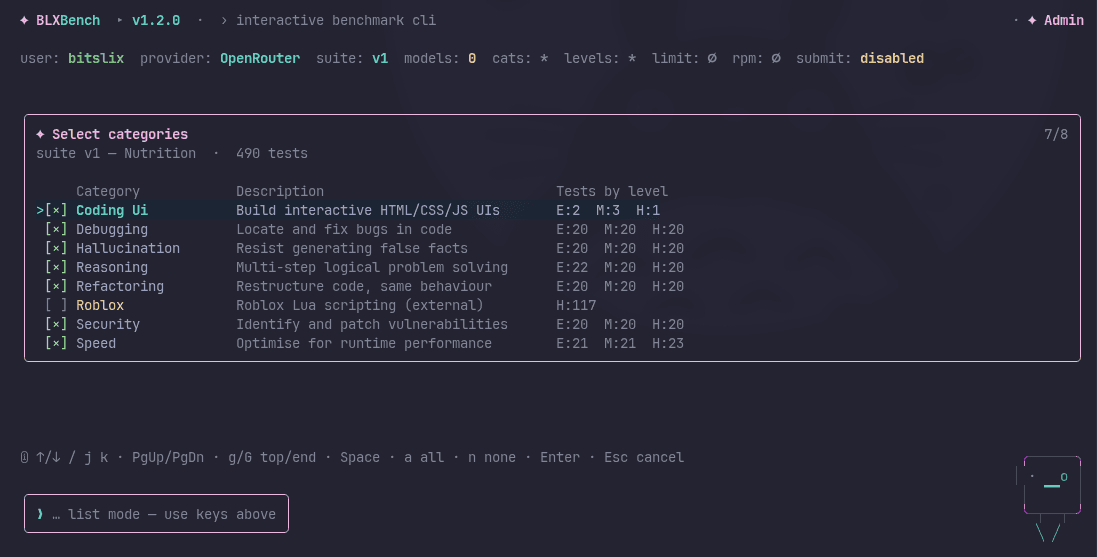
Categories
Use /categories or /set categories to toggle benchmark categories. Each row shows a description and the test count by difficulty level:
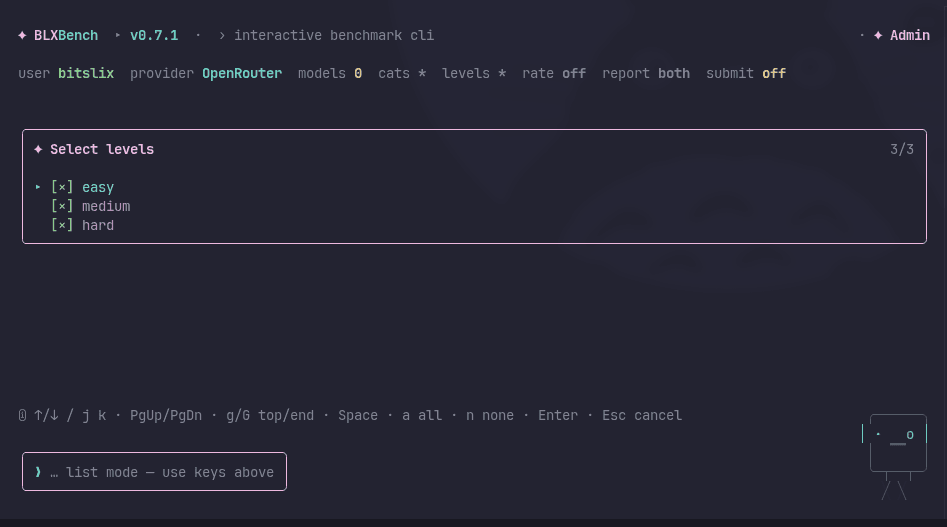
Levels
Use /levels or /set levels to choose easy, medium, and/or hard:
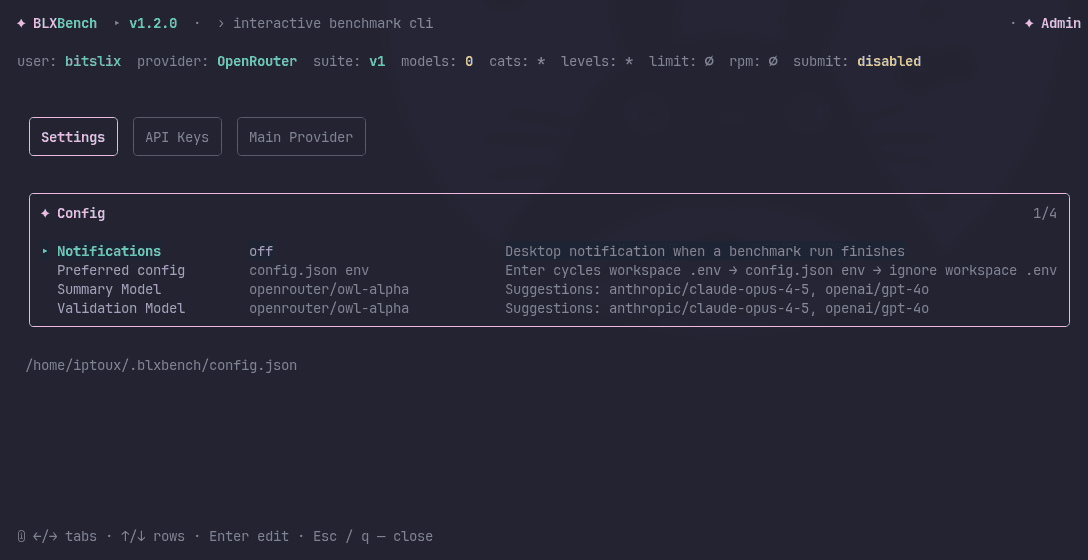
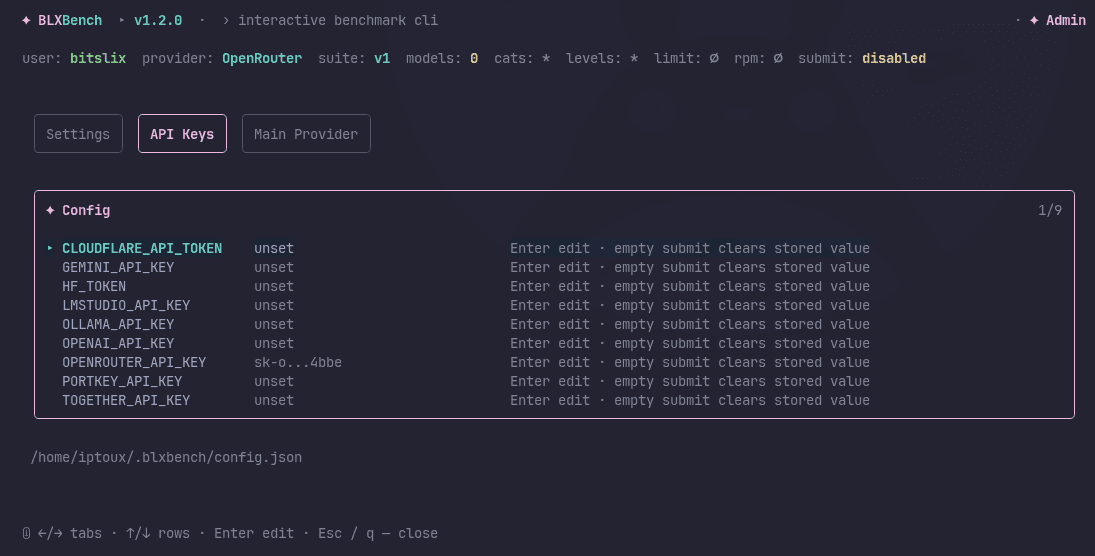
Config overlay (/config)
/config opens an interactive overlay for editing stored settings without touching files manually. It has three tabs (navigate with ← / → or Tab):
- Settings — desktop notifications, preferred config source, summary/validation model
- API Keys — view and edit provider keys stored in
~/.blxbench/config.json - Main Provider — set the default provider alias
Navigate rows with ↑ / ↓, press Enter to edit a value, Esc / q to close.
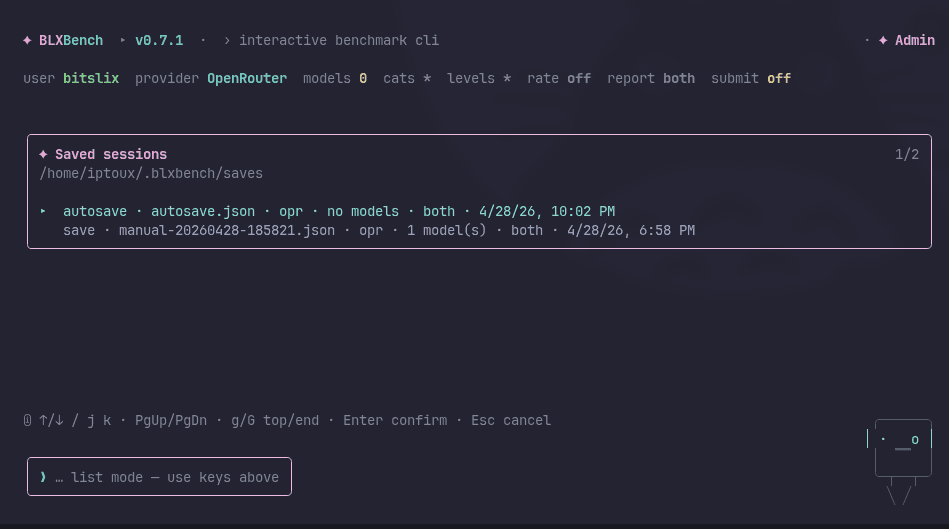
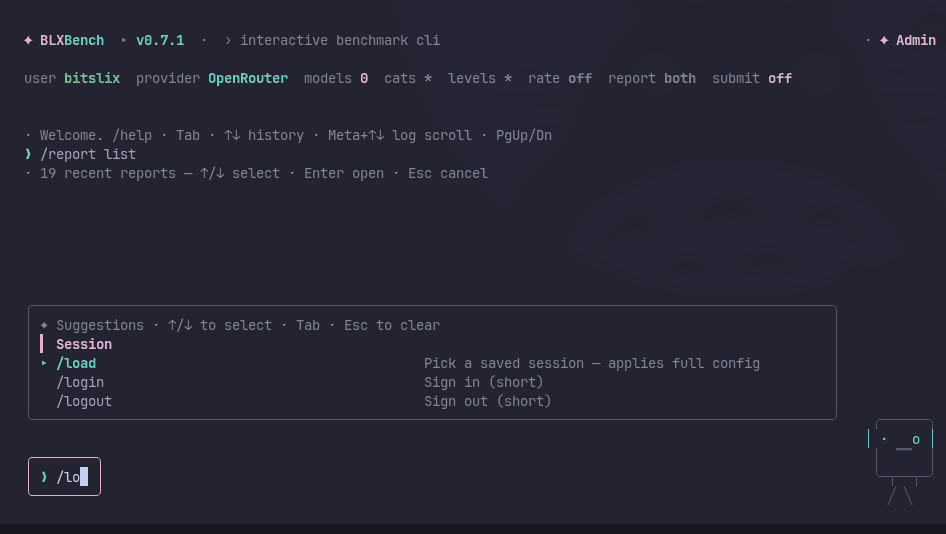
Session snapshots
Use /save and /load to persist and restore your run configuration (provider, models, category/level filters, limits, optional local_inference_port for lms/oll, report mode, submit toggle, etc.): The CLI writes JSON under ~/.blxbench/saves/ on Unix and %USERPROFILE%\.blxbench\saves\ on Windows.
Separate from snapshots, /set notify on (or /notify) stores desktop notification preferences in ~/.blxbench/config.json — optional OS hints when a run finishes. See Configuration — Desktop notifications.
- With a label (or the default),
/savecreates a new timestamped file each time so you can keep checkpoints. /loadopens a picker (same keys as/report list: ↑/↓, Enter, Esc) and replaces the whole active configuration when you confirm — use/showto verify before/run.- Snapshot files hold only run settings. Provider API keys and your BLXBench credentials stay in environment variables and the separate local credentials file managed by
/auth— they are not copied into snapshots.
Autosave: while you are in the interactive shell (not during an active run replay), the CLI can periodically overwrite a single file named autosave.json in the same saves directory so you always have a recent backup. Configure the interval with the environment variable BLXBENCH_AUTOSAVE_SEC (seconds); set it to 0 to turn autosave off. See Configuration.
Invalid or hand-edited snapshot files fail validation when you load them — the TUI shows an error instead of applying a broken config.
Running Benchmark
Watch real-time progress during execution:
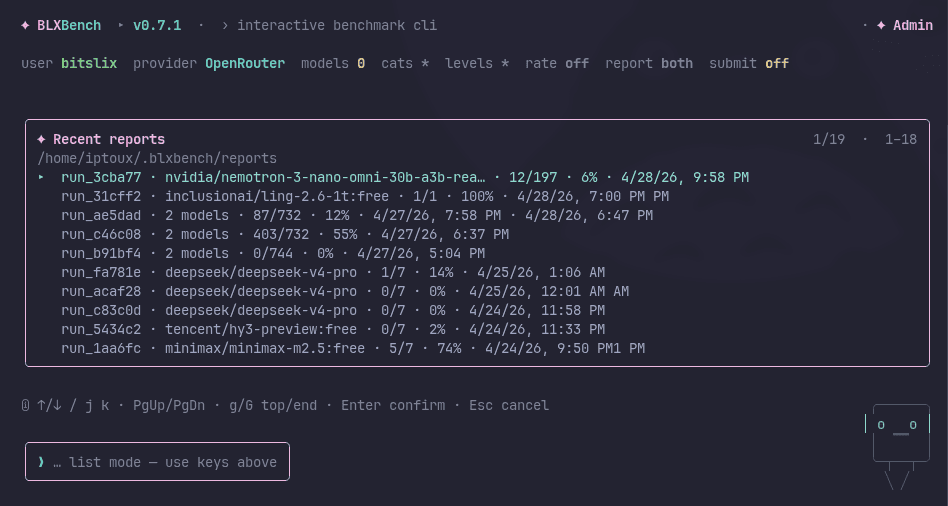
Recent reports (/report list)
Open /report list to browse recent runs under your report root (default ~/.blxbench/reports on Unix, %USERPROFILE%\.blxbench\reports on Windows). Navigate with ↑/↓ or j/k, PgUp/PgDn, g / G (top/end), then Enter to open a report. Esc cancels.
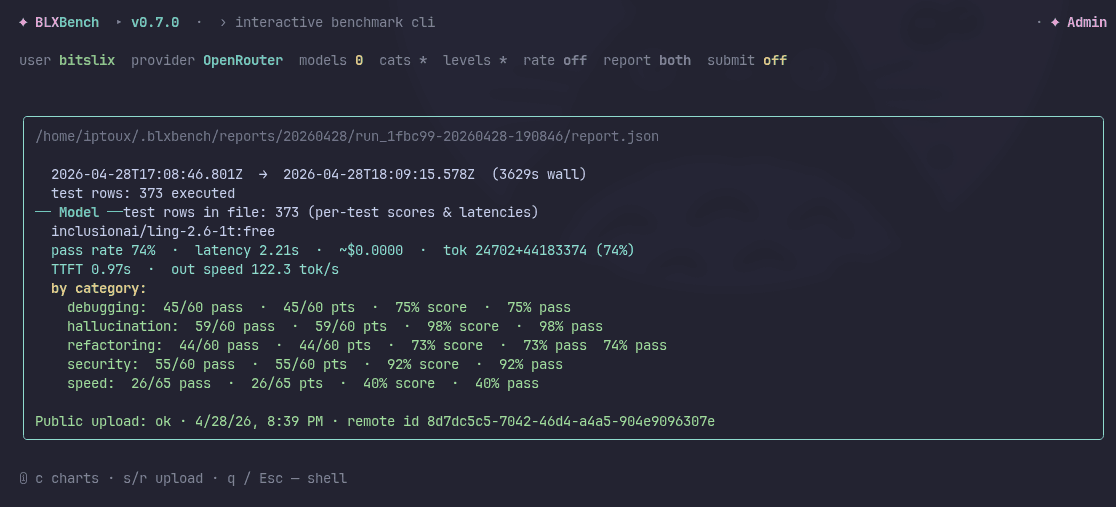
Report details — text replay
The report replay view (from /report list, or d right after a run) shows the same report.json as a scrollable text summary: timing, per-model stats, category breakdown, and provider cost where available. The path at the top is the JSON file; open the sibling index.html in a browser for the full HTML report when report is html or both.
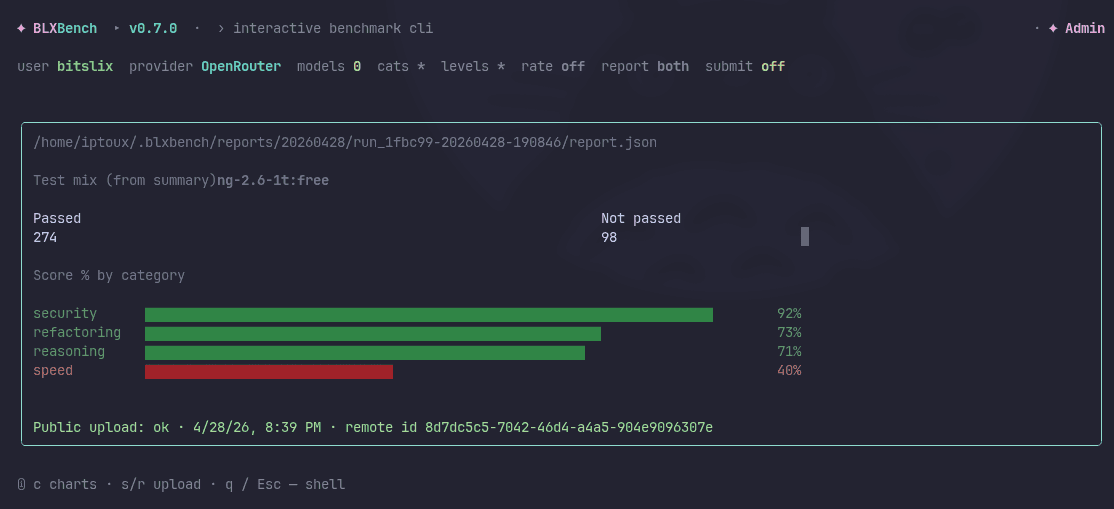
Report details — charts
Press c to toggle charts in the report replay: category score bars (and related visuals) for the current model. If the run used more than one model, press m to cycle which model the charts use. Press c again to return to the text view.
Navigation
| Key | Action |
|---|---|
Tab | Complete slash-command suggestions |
Enter | Run the current command |
Ctrl+C | Exit |
While typing a slash command, Tab and the suggestion panel help you pick commands and see short descriptions:
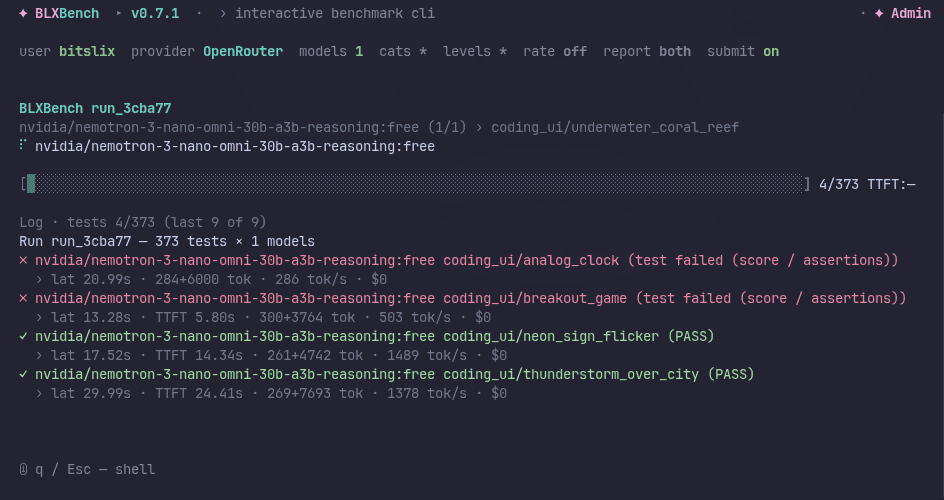
During a benchmark (run dashboard)
While /run is active, the run dashboard shows the model (and current test when known) on the line above the progress bar. The bar counts completed tests (done / total) across models; TTFT on that line reflects the in-flight request when applicable.
At the right end of that same line, blxbench shows a live cumulative cost (· run $…) — the sum of per-test cost_usd values for every finished test in this run (including multi-model runs). Skipped tests contribute $0. The number uses the same rounding style as the $ figures on the log lines under the bar.
While tests are executing (not only on the idle summary after a run):
| Key | Action |
|---|---|
a | Open Arcade minigames — benchmark continues in the background; Esc / q closes the overlay |
p | Pause the run — waits for the current test to finish, writes a pause snapshot, then holds. You can resume later with /resume from the shell or press r to continue immediately in the same session. |
Paused run screen
When the run is paused (snapshot saved):
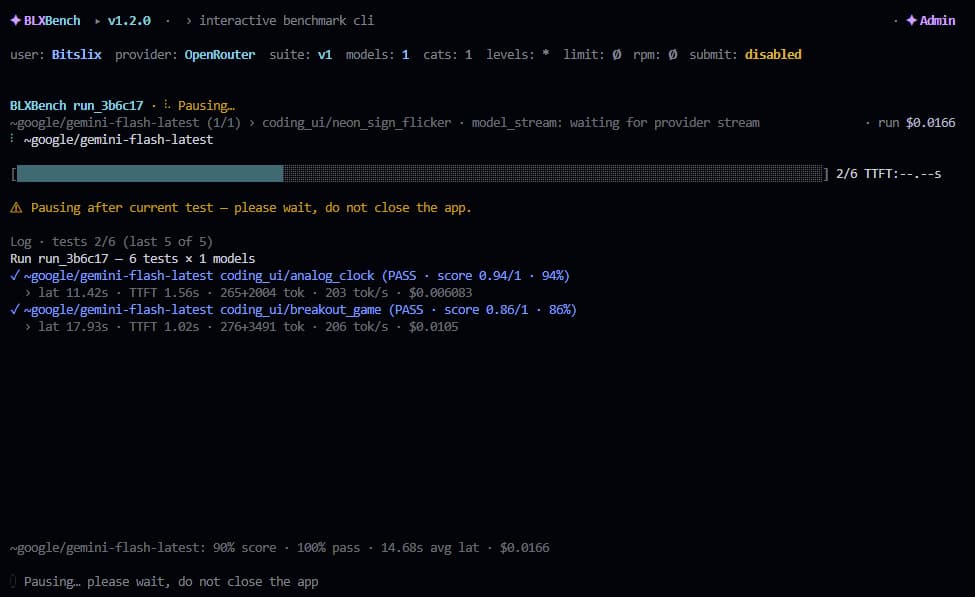
| Key | Action |
|---|---|
r | Resume immediately — continues from the saved test index in the same session |
q / Esc | Return to the shell — snapshot is kept on disk; use /resume later to pick it up |
Pause snapshots are stored under ~/.blxbench/pauses/ (Unix) or %USERPROFILE%\.blxbench\pauses\ (Windows). The final report generated after resuming includes results from both the pre-pause and post-resume sessions and is marked as a resumed run in the web detail view.
After a benchmark finishes (run dashboard)
The run dashboard stays open with a per-model summary, log, and a line pointing at your local report. With the default report mode (both or html), the TUI shows Report HTML: and the path to index.html in the run folder. If you set /set report json, it shows Report JSON: instead (no index.html is written in that mode).
| Key | Action |
|---|---|
d | Open report details (replay view) for this run — same screen as choosing a file in /report list |
s / r | Upload the run’s report.json to the public leaderboard (manual; works even when /report submit is off), if you are signed in and your role may submit |
q / Esc | Return to the shell (the benchmark does not re-run) |
The footer while a run is active looks like: d — report details · s / r — upload · q / Esc — shell.
Report details (replay)
Opened from d after a run, or from /report list → Enter on a row. This view reads the selected report.json.
| Key | Action |
|---|---|
c | Toggle charts (category bars, etc.) vs text summary |
m | When charts are on and multiple models ran, switch to the next model’s chart |
s / r | Upload this file to the leaderboard (same rules as on the run dashboard) |
q / Esc | Back to the shell |
Upload still sends report.json to the server; the HTML file is for local viewing and sharing.
Common Commands
The status line under the header shows user, provider, models, cats (category filter), levels (difficulty filter), rate, report, and submit at a glance.
| Command | Action |
|---|---|
/help | Show all commands by category |
/show | Show the active configuration |
/provider or /set provider | Open the provider list and pick a registered adapter (no extra text on the command line) |
/models list | Fetch models from the current provider |
/models id,id | Set model ids directly |
/categories or /set categories | Open the category checklist; use Space / a / n / Enter to pick embedded names. /categories * = all categories. You cannot type category names after the command. |
/levels or /set levels | Open the difficulty checklist (easy / medium / hard from the suite). /levels * = all levels. You cannot type level names after the command. |
/limit N | Limit tests per category |
/ratelimit RPM-or-off | Throttle provider requests |
| `/report html | json |
| `/report submit on | off` |
/report list | List recent reports (same report root) — Enter opens report replay (text + c charts) or upload with s / r |
/resume | Open the paused-run list and continue a paused benchmark from where it stopped (↑/↓ · Enter · Esc) |
/save [label] | Save the current configuration to a JSON snapshot under ~/.blxbench/saves/ (Unix) or %USERPROFILE%\.blxbench\saves\ (Windows) |
/load | Open the saved-snapshot list and apply the selected file |
/output-dir PATH or /set output-dir PATH | Change the report directory |
/report browser install | Install the optional native Report Browser desktop app |
/report browser open | Launch the installed Report Browser |
/report browser uninstall | Remove the installed Report Browser |
/auth login | Sign in with browser device login |
/auth whoami | Show the signed-in account |
/usage | Usage overlay — masked email, pass / subscription summary, weekly public bench quota per model (heaviest model vs cap, optional per-model lines, UTC week end). Fetches live data from the app you signed into. Close with Esc, Enter, or q. |
/pass | Same as /usage (not the browser /pass checkout page). |
/arcade | Arcade — minigame picker from the shell (no run required). |
/playwright install | Install Playwright Chromium |
/run | Start the benchmark |
Account Login
/auth login starts the blxbench device flow. blxbench opens the web app, you approve the displayed code in the browser, and blxbench stores local credentials in your user config directory.
Leaderboard submission requires a signed-in account with a pass tier that includes submission quota: Scout, Bencher, Founder, or Admin. Headless automation can instead use BLXBENCH_API_KEY with --submit.
Public leaderboard uploads are only accepted for full, unfiltered benchmark runs (among other checks). Runs with category, level, or per-category limit filters, /set limit, fail-fast / early exit, or incomplete execution are rejected by the API — you can still run and review them locally. See Public submission rules.
Some deployments may additionally require a verified report.json (cryptographic signing). If your upload fails with an integrity or signature error, use a CLI build that supports signing and follow your operator’s instructions; no key material belongs in snapshot or report files you share in chat.
Local Reports
By default, TUI runs write reports under ~/.blxbench/reports/ on Linux/macOS and %USERPROFILE%\.blxbench\reports\ on Windows. Use /set output-dir PATH to override this for the current run. /report clear cleans the report directory while preserving/resetting ranking files.
/report list scans for recent report.json files under that effective path (default or your /set output-dir). If you change the output directory, the list uses the new location — it does not read from a different folder than the one your runs use.
After each public upload attempt (auto, s/r on a finished run, or from /report list), the CLI appends a local audit trail to the same report.json under the key blxbench_cli.public_submissions (timestamp, success or HTTP error, remote ids on success). That field is not sent to the server on upload, so you can see later what was published from this file.
Provider API keys remain local in your environment or .env. TUI sign-in is only for BLXBench account features such as eligible leaderboard upload.
Features
- Interactive model selection — Type model ids, or use
/models list; provider, categories, and levels are chosen in on-screen lists (not by typing names after the slash command) - Real-time progress — Watch benchmark execution
- Account integration — Sign in via browser device login and upload eligible reports
- Manual upload — After a run,
s/rupload the report without turning auto-submit on;/report listordopens the report replay (text + optional charts) - Command help — Slash-command reference with completion